8 Main Figures
This chapter demonstrates the R and the dot codes that make the main figures shown in the paper. Making the supplementary text figures are shown in Chapter 9.
8.1 Figure 1
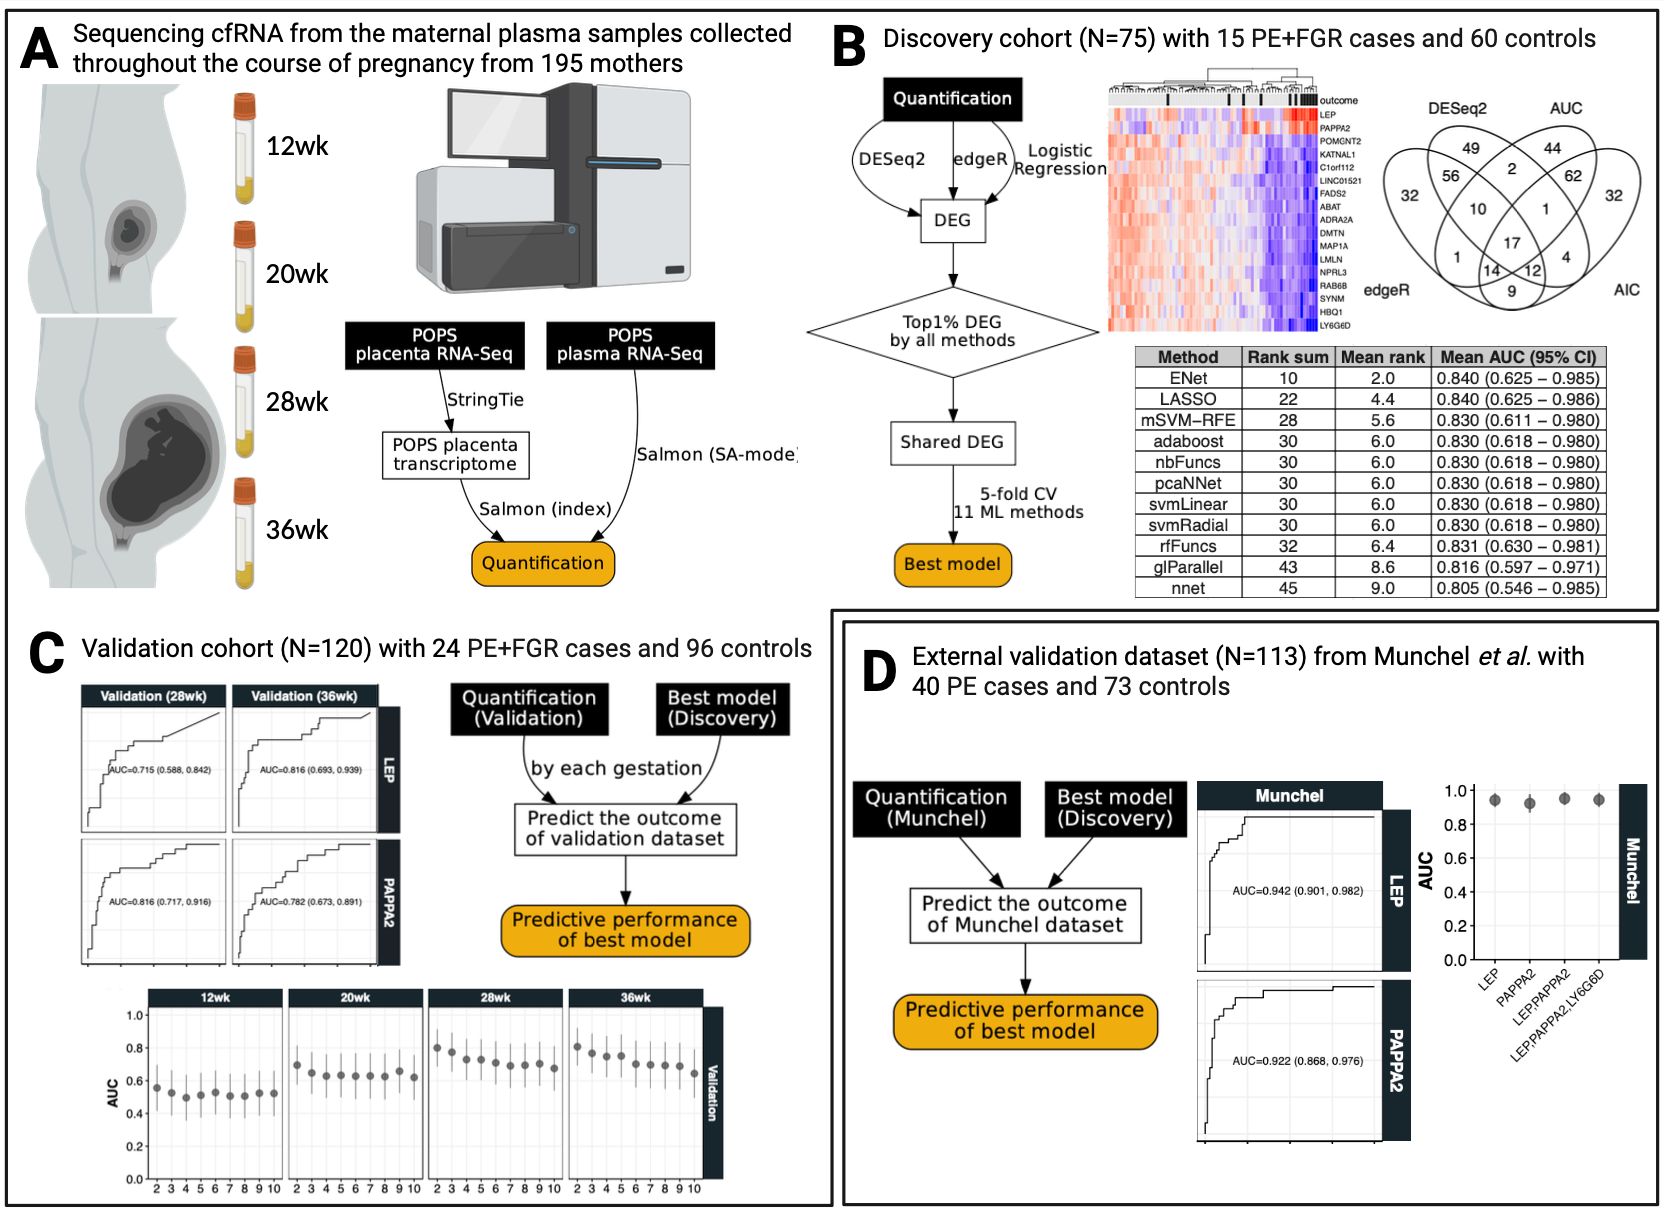
Figure 1 was made using the Biorender, except some inlet figures (shown further below, e.g. Section 8.2, Section 8.3, Section 8.4, Section 8.5) made by R, and workflow diagrams (e.g. Figure 8.2, Figure 8.3, Figure 8.4, Figure 8.5) written in DOT (Graphic Description Language) such as Graphviz, where you can see some example codes shown below.
8.1.1 The dot code in Figure 1A
static/dot/cfRNA_quant_workflow2.quant.gv
digraph G {
  node [fontname = "Handlee", color=black, fontcolor=black];
  edge [fontname = "Handlee", color=black, fontcolor=black];

  placenta_rna[
    label = "POPS\nplacenta RNA-Seq";
    shape = rect;
    style = filled;
    fontcolor = white;
  ];

  plasma_rna [
    label = "POPS\nplasma RNA-Seq";
    shape = rect;
    style = filled;
    fontcolor = white;
  ];

  pops[
    label = "POPS placenta\ntranscriptome";
    shape = rect;
    color = black;
    fontcolor = black;
  ];

  quant_pops [
    label = "Quantification";
    style = "rounded,filled";
    fillcolor = "darkgoldenrod2"
    shape = rect;
    color = black;
  ];

  placenta_rna-> pops[label="StringTie"];
  pops-> quant_pops[label="Salmon (index)"];
  plasma_rna -> quant_pops[label="Salmon (SA-mode)"]

  {rank=same; placenta_rna plasma_rna}
}8.1.2 The dot code in Figure 1B
static/dot/cfRNA_quant_workflow2.discovery.gv
digraph G {
  /*rankdir=LR; */
  node [fontname = "Handlee", color=black, fontcolor=black];
  edge [fontname = "Handlee", color=black, fontcolor=black];

  quant_pops [
    label = "Quantification";
    shape = rect;
    style = filled;
    fontcolor = white;
  ];

  deg_pops [
    label = "DEG";
    shape = rect;
  ];

  core_deg[
    label = "Shared DEG";
    shape = rect;
  ];

  best_model [
    label = "Best model";
    style = "rounded,filled";
    fillcolor = "darkgoldenrod2"
    shape = rect;
    color = black;
  ];

  check_top1[
    label = "Top1% DEG\nby all methods";
    shape = diamond;
  ];

  quant_pops-> deg_pops[label="DESeq2"];
  quant_pops-> deg_pops[label="edgeR"];
  quant_pops-> deg_pops[label="Logistic\nRegression"];

  deg_pops-> check_top1;
  check_top1-> core_deg;
  core_deg-> best_model [label="5-fold CV\n11 ML methods"];

/*
  {rank=same; check_top1  core_deg}
  {rank=same; best_model deg_pops}
*/
}8.1.3 The dot code in Figure 1C
static/dot/cfRNA_quant_workflow2.validation.gv
digraph G {
  /*rankdir=LR; */
  node [fontname = "Handlee", color=black, fontcolor=black];
  edge [fontname = "Handlee", color=black, fontcolor=black];

  quant_pops [
    label = "Quantification\n(Validation)";
    shape = rect;
    style = filled;
    fontcolor = white;
  ];

  best_model [
    label = "Best model\n(Discovery)";
    shape = rect;
    style = filled;
    fontcolor = white;
  ];

  predict [
    label = "Predict the outcome\nof validation dataset";
    shape = rect;
  ];

  score [
    label = "Predictive performance\nof best model";
    style = "rounded,filled";
    fillcolor = "darkgoldenrod2"
    shape = rect;
    color = black;
  ];

  quant_pops -> predict [label="by each gestation"];
  best_model -> predict;
  predict -> score;

/*  {rank=same; predict best_model} */
}8.1.4 The dot code in Figure 1D
static/dot/cfRNA_quant_workflow2.munchel.gv
digraph G {
  /*rankdir=LR; */
  node [fontname = "Handlee", color=black, fontcolor=black];
  edge [fontname = "Handlee", color=black, fontcolor=black];

  quant_munchel [
    label = "Quantification\n(Munchel)";
    shape = rect;
    style = filled;
    fontcolor = white;
  ];

  best_model [
    label = "Best model\n(Discovery)";
    shape = rect;
    style = filled;
    fontcolor = white;
  ];

  predict [
    label = "Predict the outcome\nof Munchel dataset";
    shape = rect;
  ];

  score [
    label = "Predictive performance\nof best model";
    style = "rounded,filled";
    fillcolor = "darkgoldenrod2"
    shape = rect;
    color = black;
  ];

  quant_munchel -> predict
  best_model -> predict;
  predict -> score;

/*  {rank=same; predict best_model} */
}8.2 Figure 2
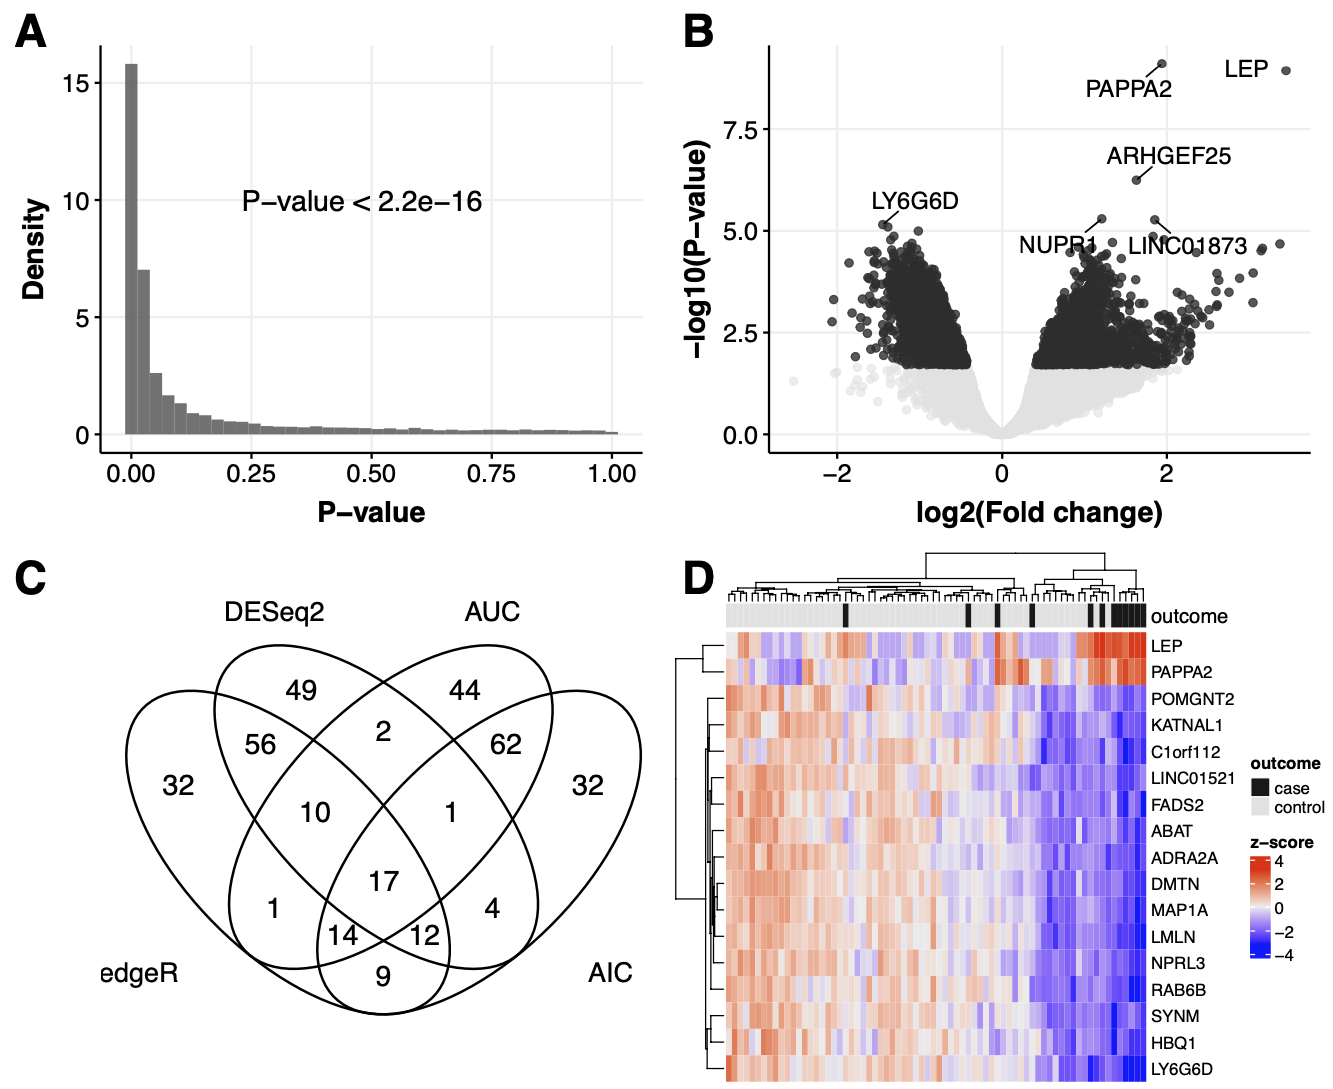
8.2.1 Figure 2A
R code to generate a histogram of p-values using ggplot
# cfRNA.preterm.PE.modelling.logitZ.POPS-2022.GRCh38.88.Rmd fig2B. histogram of
# p-values from univariable logistic regression using the 28wk discovery
load("RData/dl.logregZ.preterm.POPS-2022.GRCh38.88.RData")

sapply(dl.logregZ, function(DT) DT[padj.BH < 0.05] %>%
    nrow)

# ks.test(dl.logregZ[['28wk']]$pval,'punif',0,1) #,exact=T)

p2.hist <- ggplot(dl.logregZ[["28wk"]], aes(pval)) + geom_histogram(aes(y = ..density..),
    alpha = 0.8, bins = 40) + #geom_density(alpha=.5) + alpha = 0.8, bins = 40)
    alpha = 0.8, bins = 40) + #geom_density(alpha=.5) + +
    alpha = 0.8, bins = 40) + #geom_density(alpha=.5) + #geom_density(alpha=.5)
    alpha = 0.8, bins = 40) + #geom_density(alpha=.5) + +
xlab("P-value") + ylab("Density") + annotate("text", x = 0.48, y = 10, label = "P-value < 2.2e-16",
    size = 6) + theme_Publication()
print(p2.hist)
8.2.2 Figure 2B
Code
  load("RData/dl.res.edgeR.preterm.POPS-2022.GRCh38.88.RData") # edgeR result
  dl.res.edgeR[["28wk"]]

## cfRNA.preterm.PE.modelling.DEG.POPS-2022.GRCh38.88.Rmd
## fig1A. Volcano (28wk) - edgeR (using original p-values)
  res.edger<-dl.res.edgeR[["28wk"]]

  (dt.label<-
  rbind(
  res.edger[order(BH)][BH<0.05,.SD[c(1:6)]],
  res.edger[order(-abs(logFC))][,.SD[c(1:2)]]
  ) %>% unique)

  p2.vol<-ggplot(res.edger, aes(logFC, -log10(PValue))) +
        geom_point(data=res.edger[BH>0.05],size=2, col="grey90", alpha=.6) +
        geom_point(data=res.edger[BH<=0.05], size=2,col="grey20",alpha=.8) +
        ylab("-log10(P-value)") + xlab("log2(Fold change)") +
        ggrepel::geom_text_repel(
                                data=res.edger[order(BH)][BH<0.05,.SD[c(1:6)]] # dt.label
                                ,aes(label=gene_id),
                                box.padding = 0.6, max.overlaps = Inf,
                                #direction='gy',
                                #nudge_y=1,
                                size=5) +
        theme_Publication()
  print(p2.vol)
8.2.3 Figure 2C
Code
# cfRNA.preterm.PE.modelling.logitZ.POPS-2022.GRCh38.88.Rmd
  load("RData/dl.resLFC.preterm.POPS-2022.GRCh38.88.RData")

  venn.top1pctZ<-list(
                   `edgeR`=dl.res.edgeR[["28wk"]][order(PValue)][1:151]$gene_id,
                   `DESeq2`=dl.resLFC[["28wk"]][order(pvalue)][1:151]$gene_id,
                  `AUC`=dl.logregZ[["28wk"]][order(-auc)][1:151]$gene_id,
                  `AIC`=dl.logregZ[["28wk"]][order(AIC)][1:151]$gene_id
                  )
  p2.venn<-ggvenn::ggvenn(venn.top1pctZ,fill_color=rep("grey100",length(venn.top1pctZ)),set_name_size=5.6,text_size=6,stroke_size=.7,show_percentage=FALSE)
  print(p2.venn)

  dt.venn.top1pctZ<-lapply(names(venn.top1pctZ), function(i) data.table(i,venn.top1pctZ[[i]])) %>% rbindlist %>% dcast.data.table(V2~i, fun=length)
  setnames(dt.venn.top1pctZ,"V2","Gene")
  top1pct.genesZ<-dt.venn.top1pctZ[AIC==1 & AUC==1 & DESeq2==1 & edgeR==1]$Gene
8.2.4 Figure 2D
Code
## Heatmap of the 17 shared genes
# cfRNA.preterm.PE.modelling.WF2.POPS-2022.GRCh38.88.Rmd
  load("RData/dt.cpmZ.preterm.POPS-2022.GRCh38.88.RData")

  #top1pct.genesZ # the 17 shared DEGs
  this.mat<-dt.cpmZ[GA=="28wk" & geneName %in% top1pct.genesZ,.(SampleID,geneName,logCPMZ,y=ifelse(Condition=="Case",1,0))] %>% dcast.data.table(SampleID+y~geneName,value.var="logCPMZ") %>% as.matrix(rownames="SampleID") # %>% as.data.frame
  #pheatmap::pheatmap(t(this.mat[,top1pct.genesZ]))

  p.anno<-HeatmapAnnotation(outcome=ifelse(this.mat[,"y"]==1,"case","control"),
                            which="column",
                            col=list(outcome=c(`case`="grey10",`control`="grey90"))
                        )
  p.main<-ComplexHeatmap::Heatmap(t(this.mat[,top1pct.genesZ]),
                        name='z-score',
                        row_names_gp=gpar(fontsize=10),
                        show_column_names =F,
                        #col=circlize::colorRamp2(c(min(this.mat,na.rm=T), 0, max(this.mat,na.rm=T)), c("blue", "white", "red")),
                        top_annotation=p.anno
                        )
  p2.heat = grid.grabExpr(ComplexHeatmap::draw(p.main,merge_legend=T))
  print(p2.heat)
8.2.5 Figure 2A-D
8.3 Figure 3
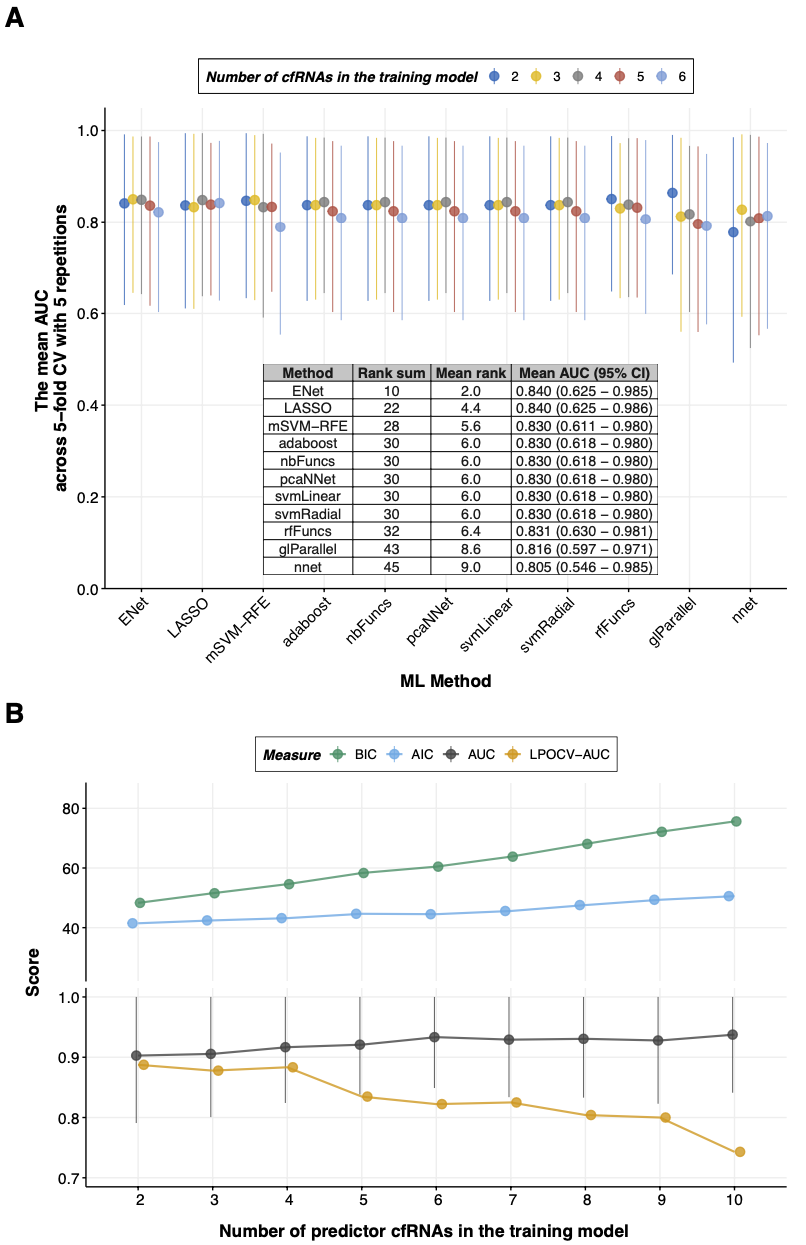
8.3.1 Figure 3A
Code
  load("RData/dl.kcv.result.core17.RData")
  #########################################################
  # Reulst of 11 ML methods based on 5-fold CV with 5 rep #
  #########################################################
  (dt.foo<-lapply(dl.kcv.result, function(DT) DT[,.(.N,
      mean_AUC_test=mean(AUC_test), mean_AUC_test_lo=mean(AUC_test_lo), mean_AUC_test_hi=mean(AUC_test_hi)
      ),method][,Rank:=frank(-mean_AUC_test)][order(Rank)]
  ) %>% rbindlist )
  (dt.bar<-dt.foo[,.(.N,N_test=sum(N),rankSum=sum(Rank),meanRank=sum(Rank)/5, #F2-F6
            meanAUC=mean(mean_AUC_test)/100,
            meanAUC_lo=mean(mean_AUC_test_lo)/100,
            meanAUC_hi=mean(mean_AUC_test_hi)/100)
  ,method][order(rankSum)])

  dt.bar[,.(`Method`=method,`Rank Sum`=rankSum,`Mean Rank`=meanRank,`Mean AUC`=meanAUC,`AUC Range`="")] %>%
  kbl(booktabs=F, digits=4) %>%
  kable_styling(latex_options = c("basic"),full_width=F,font_size=10) %>%
  #kable_styling(bootstrap_options = c("condensed"), full_width = F, font_size=10) %>%
  column_spec(5, image = spec_pointrange(
    x = dt.bar$meanAUC,
    xmin = dt.bar$meanAUC_lo,
    xmax = dt.bar$meanAUC_hi,
    cex= 0.6,
    vline = .80,
    height=50)
  ) %>% save_kable("Figures/cfRNA.Fig2.KCV.table.pdf")

  ##
  ##
  (dt.foo<-lapply(names(dl.kcv.result), function(NF)
      dl.kcv.result[[NF]][,.(NF=substr(NF,2,3),.N,
      mean_AUC=mean(AUC_test)/100, mean_AUC_lo=mean(AUC_test_lo)/100, mean_AUC_hi=mean(AUC_test_hi)/100
      ),method][,Rank:=frank(-mean_AUC)][order(Rank)]
  ) %>% rbindlist )
  dt.bar[,.(Method=method,`Rank sum`=rankSum, `Mean rank`=meanRank,round(meanAUC,3),round(meanAUC_lo,3),round(meanAUC_hi,3))][,.(Method,paste(V4,"(",V5,"-",V6,")"))]
  (dt.baz<-dt.bar[,.(Method=method,`Rank sum`=rankSum, `Mean rank`=meanRank,`Mean AUC (95% CI)`=paste0(sprintf("%.3f",meanAUC)," (",round(meanAUC_lo,3)," - ",round(meanAUC_hi,3),")"))])

  library(ggpmisc)

  p.kcv<-ggplot(dt.foo, aes(method, mean_AUC)) +
    geom_pointrange(aes(col=NF, ymin=mean_AUC_lo, ymax=mean_AUC_hi),position=position_dodge(width=0.7), size=.9,alpha=.8) +
    scale_x_discrete(limits=dt.bar$method) +
    scale_y_continuous(expand=c(0,0),breaks=c(0,.2,.4,.6,.8,1), limit=c(0,1.05)) +
    ggsci::scale_color_jco(name="Number of cfRNA in the training model") +
    labs(x="ML Method",y="The mean AUC \nacross 5-fold CV with 5 repetitions") +
    geom_table(data=data.table(x="LASSO", y=0.03, tb=list(dt.baz)),aes(x=x,y=y, label=tb), size=5, table.theme = ttheme_gtlight ) +
    theme_Publication() +
    theme(legend.position="top",
        legend.key = element_rect(fill = "transparent"),
        legend.background = element_rect(fill='transparent', linetype="solid",color="black",size=.2),
        legend.box.background = element_rect(fill='transparent'),
        axis.text.x = element_text(angle = 45, hjust=1, size=rel(1)))
8.3.2 Figure 3B
Code
  load("RData/dl.final.result.core17.RData")
  load("RData/dl.enet.result.core17.RData")
  load("RData/dt.best.result.core17.RData") # dt.best.result
 library(ggbreak)

  ###############################################
  # The final training models from LASSO & ENet #
  ###############################################
  (dt.enet.tr<-lapply(names(dl.final.result), function(FN){
    dl.final.result[[FN]][grepl("ENet",methods) & fold=="28wk(preterm)",.(Method="ENet",FN=FN,predictor,AUC=AUC_test/100,AUC_lo=AUC_test_lo/100,AUC_hi=AUC_test_hi/100,LPOCV=LPOCV_test/100,LPOCV_lo=LPOCV_test_lo/100,LPOCV_hi=LPOCV_test_hi/100)]
  }) %>% rbindlist)
  (dt.lasso.tr<-lapply(names(dl.final.result), function(FN){
    dl.final.result[[FN]][grepl("LASSO",methods) & fold=="28wk(preterm)",.(Method="LASSO",FN=FN,predictor,AUC=AUC_test/100,AUC_lo=AUC_test_lo/100,AUC_hi=AUC_test_hi/100,LPOCV=LPOCV_test/100,LPOCV_lo=LPOCV_test_lo/100,LPOCV_hi=LPOCV_test_hi/100)]
  }) %>% rbindlist)
  dt.final.tr<-rbind(dt.enet.tr, dt.lasso.tr)

  dt.final.tr[,.(Method,`Selected features`=predictor,AUC,`AUC Range`="",LPOCV,`LPOCV Range`="")]

  ##################################
  ## Train for ENet and LASSO only #
  ##################################
  lapply(names(dl.enet.result), function(FN)
    dl.enet.result[[FN]][grepl("ENet",methods) & fold=="28wk(preterm)",-c("fold")][,`:=`(Method="ENet",`N`=substr(FN,2,nchar(FN)) %>% as.integer)]
  ) %>% rbindlist

  lapply(names(dl.enet.result), function(FN)
    dl.enet.result[[FN]][grepl("LASSO",methods) & fold=="28wk(preterm)",-c("fold")][,`:=`(Method="LASSO",`N`=substr(FN,2,nchar(FN)) %>% as.integer)]
  ) %>% rbindlist

  dt.enet.lasso.tr<-lapply(names(dl.enet.result), function(FN){
    dt.foo<-dl.enet.result[[FN]][grepl("ENet",methods) & fold=="28wk(preterm)",-c("fold")][,`:=`(Method="ENet",`N`=substr(FN,2,nchar(FN)) %>% as.integer)]
    dt.bar<-dl.enet.result[[FN]][grepl("LASSO",methods) & fold=="28wk(preterm)",-c("fold")][,`:=`(Method="LASSO",`N`=substr(FN,2,nchar(FN))%>% as.integer)]

    rbind(
    dt.foo[,.(Method,N,predictor,Measure="AUC",Score=AUC_test/100,Lo=AUC_test_lo/100,Hi=AUC_test_hi/100)],
    dt.foo[,.(Method,N,predictor,Measure="LPOCV-AUC",Score=LPOCV_test/100,Lo=LPOCV_test/100,Hi=LPOCV_test/100)],
    #dt.foo[,.(Method,N,predictor,Measure="LPOCV-AUC",Score=LPOCV_test/100,Lo=LPOCV_test_lo/100,Hi=LPOCV_test_hi/100)],
    dt.foo[,.(Method,N,predictor,Measure="BIC",Score=BIC,Lo=BIC,Hi=BIC)],
    dt.foo[,.(Method,N,predictor,Measure="AIC",Score=AIC,Lo=AIC,Hi=AIC)],
    dt.bar[,.(Method,N,predictor,Measure="AUC",Score=AUC_test/100,Lo=AUC_test_lo/100,Hi=AUC_test_hi/100)],
    dt.bar[,.(Method,N,predictor,Measure="LPOCV-AUC",Score=LPOCV_test/100,Lo=LPOCV_test/100,Hi=LPOCV_test/100)],
    #dt.bar[,.(Method,N,predictor,Measure="LPOCV-AUC",Score=LPOCV_test/100,Lo=LPOCV_test_lo/100,Hi=LPOCV_test_hi/100)],
    dt.bar[,.(Method,N,predictor,Measure="BIC",Score=BIC,Lo=BIC,Hi=BIC)],
    dt.bar[,.(Method,N,predictor,Measure="AIC",Score=AIC,Lo=AIC,Hi=AIC)]
    )
  }
  ) %>% rbindlist

  p.enet.lasso.tr<-ggplot(dt.enet.lasso.tr[Method=="ENet"], aes(N,Score,group=Measure)) +
    geom_pointrange(aes(col=Measure,ymin=Lo, ymax=Hi),position=position_dodge(width=0.2), size=.9,alpha=.8) +
    geom_line(aes(col=Measure),size=1,alpha=.8) +
    scale_x_discrete(limits=2:10) +
    scale_y_continuous(limits=c(0.7,max(dt.enet.lasso.tr$Score+10)),expand=c(0,0)) +
    scale_color_manual(values=c(cbPalette[4],cbPalette[3],"grey30",cbPalette[2]), breaks=c("BIC","AIC","AUC","LPOCV-AUC")) +
    labs(x="Number of predictor cfRNA in the training model",y="Score") +
    #facet_wrap(Method~.,ncol=2,scales="free_y",strip.position="top") +
    ggbreak::scale_y_break(c(1, 25),scales="free") +
    theme_Publication() +
    theme(legend.position="top",
      legend.key = element_rect(fill = "transparent"),
      legend.background = element_rect(fill='transparent', linetype="solid",color="black",size=.2),
      legend.box.background = element_rect(fill='transparent'),
      axis.text.y.right = element_blank(),
      axis.ticks.y.right = element_blank(),
      axis.line.y.right = element_blank(),
      plot.margin=unit(c(-3,0.2,0.2,0.2),"cm")
    )
8.3.3 Figure 3A-B
8.4 Figure 4
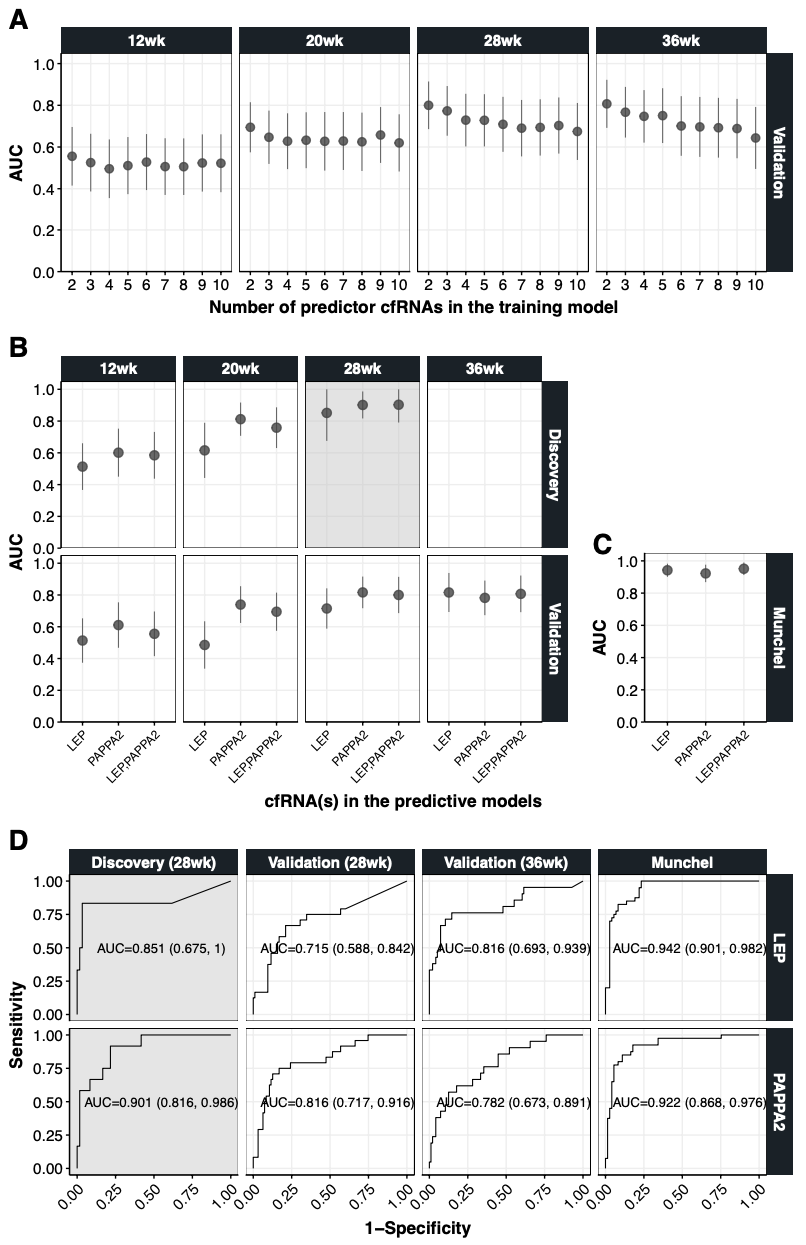
8.4.1 Figure 4A
Code
  #########################################
  ## Validation result using Enet & LASSO #
  #########################################
  dt.enet.lasso.val<-lapply(names(dl.enet.result), function(FN){
    rbind(
    dl.enet.result[[FN]][grepl("ENet",methods),.(FN=FN,Method="ENet",predictor,fold,AUC=AUC_test/100,AUC_lo=AUC_test_lo/100,AUC_hi=AUC_test_hi/100)],
    dl.enet.result[[FN]][grepl("LASSO",methods),.(FN=FN,Method="LASSO",predictor,fold,AUC=AUC_test/100,AUC_lo=AUC_test_lo/100,AUC_hi=AUC_test_hi/100)]
    )
  }) %>% rbindlist
  dt.enet.lasso.val[,FN:=substr(FN,2,length(FN))]
  dt.enet.lasso.val$FN<-factor(dt.enet.lasso.val$FN,level=2:10)#<- # isa `char`
  dt.enet.lasso.val[,Source:=ifelse(fold=="Munchel",fold,ifelse(grepl("preterm",fold),"Discovery","Validation"))]
  xtabs(~fold+Source+Method, dt.enet.lasso.val)

  # Mean validated AUC by GA and Method
  dt.enet.lasso.val[fold=="12wk(term)"][order(-AUC)][,.(.N,Mean=mean(AUC),SD=sd(AUC),Max=max(AUC),Min=min(AUC)),.(Method)]
  dt.enet.lasso.val[fold=="20wk(term)"][order(-AUC)][,.(.N,Mean=mean(AUC),SD=sd(AUC),Max=max(AUC),Min=min(AUC)),.(Method)]
  dt.enet.lasso.val[fold=="28wk(term)"][order(-AUC)][,.(.N,Mean=mean(AUC),SD=sd(AUC),Max=max(AUC),Min=min(AUC)),.(Method)]
  dt.enet.lasso.val[fold=="36wk(term)"][order(-AUC)][,.(.N,Mean=mean(AUC),SD=sd(AUC),Max=max(AUC),Min=min(AUC)),.(Method)]

  # Mean validated AUC by GA merging the two methods
  dt.enet.lasso.val[fold=="12wk(term)"][order(-AUC)][,.(.N,Mean=mean(AUC),SD=sd(AUC),Max=max(AUC),Min=min(AUC))]
  dt.enet.lasso.val[fold=="20wk(term)"][order(-AUC)][,.(.N,Mean=mean(AUC),SD=sd(AUC),Max=max(AUC),Min=min(AUC))]
  dt.enet.lasso.val[fold=="28wk(term)"][order(-AUC)][,.(.N,Mean=mean(AUC),SD=sd(AUC),Max=max(AUC),Min=min(AUC))]
  dt.enet.lasso.val[fold=="36wk(term)"][order(-AUC)][,.(.N,Mean=mean(AUC),SD=sd(AUC),Max=max(AUC),Min=min(AUC))]

  # Best performing model by GA
  dt.enet.lasso.val[Source=="Validation" & Method=="ENet",.(Method,fold,FN,predictor,AUC)][order(fold,-AUC)][,.SD[1],fold]
  dt.enet.lasso.val[Source=="Validation" & Method=="LASSO",.(Method,fold,FN,predictor,AUC)][order(fold,-AUC)][,.SD[1],fold]

  # get the best performing model by Lasso and ENet separately
  dt.enet.lasso.val[Source=="Validation"][order(Method,fold,-AUC)][,.SD[1],.(Method,fold)]

  #
  dt.foo<-dt.enet.lasso.val[Source=="Validation"][,GA:=substr(fold,1,4)]
  p.enet.lasso.val<-ggplot(dt.foo, aes(GA, AUC,col=Method)) +
    geom_pointrange(aes(ymin=AUC_lo, ymax=AUC_hi),position=position_dodge(width=0.7), size=.9,alpha=.8) +
    scale_color_manual(values=c("grey30","grey60")) +
    scale_y_continuous(expand=c(0,0),breaks=c(0,.2,.4,.6,.8,1), limit=c(0,1.05)) +
    ylab("AUC") + xlab("Gestational age (validation dataset)") +
    facet_wrap(~FN,nrow=1) +
    theme_Publication() +
    theme(legend.position="top",
          axis.text.x = element_text(angle = 45, hjust=1, size=rel(.8)))
  #
  p.enet.lasso.val2<-ggplot(dt.foo, aes(FN, AUC,col=Method)) +
    geom_pointrange(aes(ymin=AUC_lo, ymax=AUC_hi),position=position_dodge(width=0.8), size=.8,alpha=.8) +
    scale_color_manual(values=c("grey30","grey60")) +
    scale_y_continuous(expand=c(0,0),breaks=c(0,.2,.4,.6,.8,1), limit=c(0,1.05)) +
    ylab("AUC") + xlab("Number of predictor cfRNA in the training model") +
    facet_grid(Source~GA) +
    theme_Publication() +
    theme(legend.position="top")
  #
  dt.foo<-dt.enet.lasso.val[Source=="Validation" & Method=="ENet"][,GA:=substr(fold,1,4)]
  p4.enet.lasso.val3<-ggplot(dt.foo, aes(FN, AUC)) +
    geom_pointrange(aes(ymin=AUC_lo, ymax=AUC_hi), size=.8,alpha=.8, col="grey30") +
    scale_y_continuous(expand=c(0,0),breaks=c(0,.2,.4,.6,.8,1), limit=c(0,1.05)) +
    ylab("AUC") + xlab("Number of predictor cfRNA in the training model") +
    facet_grid(Source~GA) +
    theme_Publication() +
    theme(legend.position="top", panel.border = element_rect(colour = "black"))

  p4.enet.lasso.val4<-ggplot(dt.foo, aes(FN, AUC)) +
    geom_pointrange(aes(ymin=AUC_lo, ymax=AUC_hi,col=GA), position=position_dodge(width=.8), size=.8,alpha=.8) +
    scale_y_continuous(expand=c(0,0),breaks=c(0,.2,.4,.6,.8,1), limit=c(0,1.05)) +
    ggsci::scale_color_jama() +
    ylab("AUC") + xlab("Number of predictor cfRNA in the training model") +
    facet_grid(Source~.) +
    theme_Publication() +
    theme(legend.position="top", panel.border = element_rect(colour = "black"))
8.4.2 Figure 4B
Code
  ########################################################################
  ## Two univariable cfRNA models (LEP and PAPPA2) + 2- and 3-cfRNA models #
  ########################################################################
  #dt.best.result[predictor=="LEP,LY6G6D,PAPPA2",predictor:="LEP,PAPPA2,LY6G6D"] # rename
  dt.best.result<-dt.best.result[predictor!="LEP,LY6G6D,PAPPA2"] # remove these rows
  dt.best.result[,Source:=ifelse(fold=="Munchel",fold,ifelse(grepl("preterm",fold),"Discovery","Validation"))]

  dt.best.result[Source=="Discovery"]
  dt.best.result[Source=="Validation"]
  dt.best.result[Source=="Munchel"][order(-AUC_test)]

  dt.baz<-dt.best.result[Source!="Munchel",.(Source,fold,predictor,AUC=AUC_test/100,AUC_lo=AUC_test_lo/100,AUC_hi=AUC_test_hi/100)][,GA:=substr(fold,1,4)]
  p4.top.model<-ggplot(dt.baz, aes(predictor, AUC)) +
    geom_rect(data = dt.baz[Source=="Discovery" & GA=="28wk"],aes(fill = GA),fill="grey80",xmin = -Inf,xmax = Inf, ymin = -Inf,ymax = Inf,alpha = 0.2) +
    geom_pointrange(aes(ymin=AUC_lo, ymax=AUC_hi),col="grey30",size=.9,alpha=.8) +
    scale_x_discrete(limits=dt.baz[,.N,predictor]$predictor) +
    scale_y_continuous(expand=c(0,0),breaks=c(0,.2,.4,.6,.8,1), limit=c(0,1.05)) +
    ylab("AUC") + xlab("cfRNA(s) in the predictive models") +
    facet_grid(Source~GA) +
    theme_Publication() +
    theme(legend.position="",
          axis.text.x = element_text(angle = 45, hjust=1, size=rel(.8)),
                axis.title.x = element_text(hjust = 1), # align the title to the right
          panel.border = element_rect(colour = "black"))
8.4.3 Figure 4C
Code
  dt.qux<-dt.best.result[Source=="Munchel",.(Source,fold,predictor,AUC=AUC_test/100,AUC_lo=AUC_test_lo/100,AUC_hi=AUC_test_hi/100)]
  p4.top.model.munchel<-ggplot(dt.qux, aes(predictor, AUC)) +
    geom_pointrange(aes(ymin=AUC_lo, ymax=AUC_hi),col="grey30",size=.9,alpha=.8) +
    scale_x_discrete(limits=dt.baz[,.N,predictor]$predictor) +
    scale_y_continuous(expand=c(0,0),breaks=c(0,.2,.4,.6,.8,1), limit=c(0,1.05)) +
    ylab("AUC") + xlab("") +
    facet_grid(Source~.) + #,nrow=1) +
    theme_Publication() +
    theme(axis.text.x = element_text(angle = 45, hjust=1, size=rel(.8)),
          panel.border = element_rect(colour = "black"))
8.4.4 Figure 4D
Code
  # dt.roc.data from WF2.extra.bits2.Rmd
  lazyLoad("WF2.extra.bits2_cache/beamer/roc_lep_pappa2_3110fa4c16ccfa47c784596b3531122d")
  p4.roc.curve<-ggplot(dt.roc.data, aes(1-specificity,sensitivity)) +
    geom_rect(data = dt.roc.data[dataset=="Discovery (28wk)"], aes(xmin = -Inf,xmax = Inf, ymin = -Inf,ymax = Inf),fill="grey90",alpha = 0.1) +
    geom_line() +
    geom_text(data=dt.roc,size=4,
              mapping=aes(x=.55,y=.5,label=paste0("AUC=",round(roc,3)," (",round(roc_lo,3),", ",round(roc_hi,3),")"))
              ) +
    ylab("Sensitivity") + xlab("1-Specificity") +
    facet_grid(geneName~dataset) +
    theme_Publication() +
    theme(legend.position="",
          axis.text.x = element_text(angle = 45, hjust=1),
          panel.border = element_rect(colour = "black"))
8.4.5 Figure 4A-D
Code
  p4.middle.right<-cowplot::plot_grid(NULL,p4.top.model.munchel,labels=c("","C"),ncol=1,label_size=27,rel_heights=c(1,1.5))
  p4.middle<-cowplot::plot_grid(p4.top.model, p4.middle.right, labels=c("B",""),label_size=27,rel_widths=c(2.6,1))

  pdf(file="Figures/cfRNA.Fig4.pdf", width=11, height=17, title="Fig4: model selection and validation")
  cowplot::plot_grid(p4.enet.lasso.val3, p4.middle, p4.roc.curve, nrow=3,labels=c("A","","D"),label_size=27,rel_heights=c(1,1.5,1.3), align="v", axis="b")
  dev.off()
8.5 Figure 5
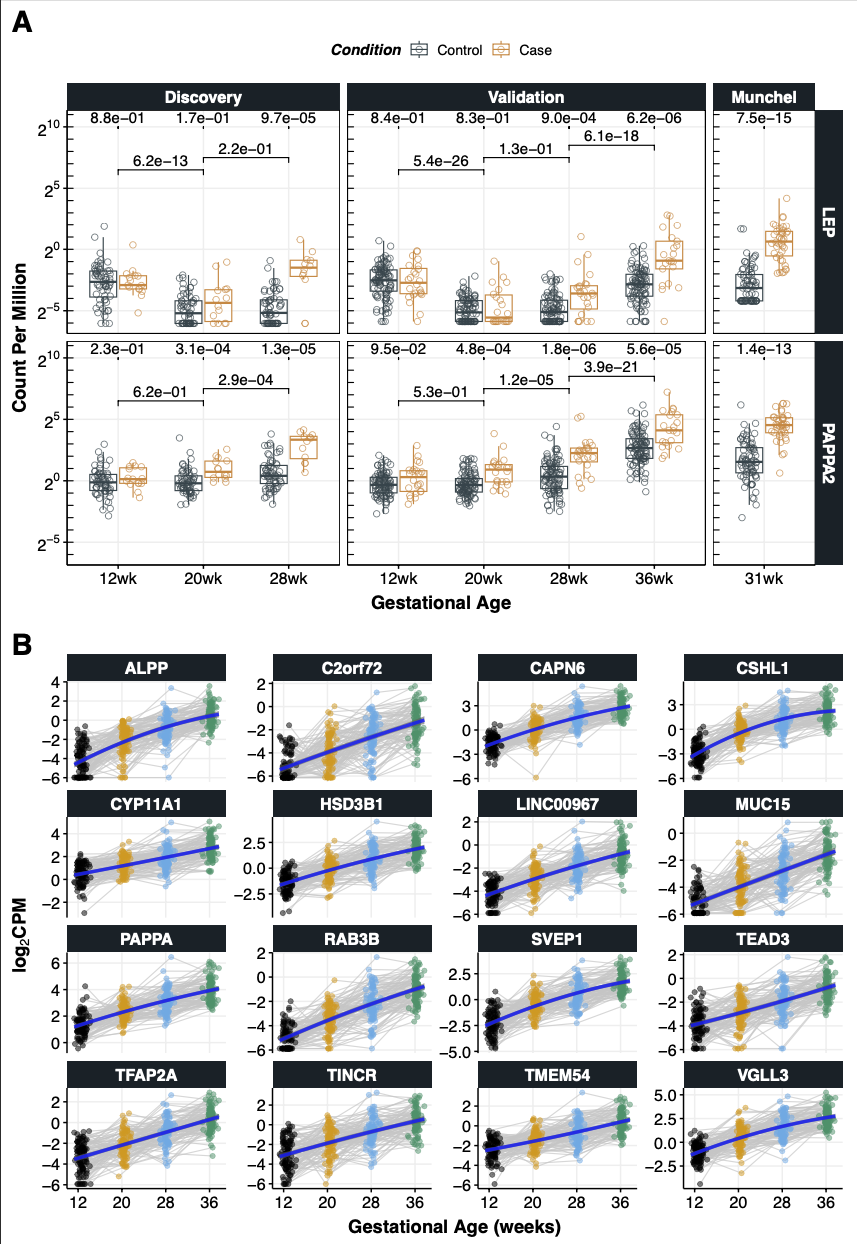
8.5.1 Figure 5A
Code
  load("RData/dt.cpmZ.preterm.POPS-2022.GRCh38.88.RData") # dt.cpmZ (preterm)
  load("RData/dt.cpmZ.term.POPS-2022.GRCh38.88.RData") # dt.cpmZ.term (term)
  load("RData/dt.cpmZ.munchel.RData") # dt.cpmZ.munchel (Munchel)

  dt.foo<-rbind(
    dt.cpmZ[geneName %in% c("LEP","PAPPA2"),.(dataset="Discovery",GA,Condition,geneName,logCPM,logCPMZ)],
    dt.cpmZ.term[geneName %in% c("LEP","PAPPA2"),.(dataset="Validation",GA,Condition,geneName,logCPM,logCPMZ)],
    dt.cpmZ.munchel[geneName %in% c("LEP","PAPPA2"),.(dataset="Munchel",GA="31wk",Condition,geneName,logCPM,logCPMZ)]
    )
  dt.foo[,CPM:=2^logCPM]
  dt.foo$Condition<-factor(dt.foo$Condition, level=c("Case","Control"))
  dt.foo$dataset<-factor(dt.foo$dataset, level=c("Discovery","Validation","Munchel"))

  #
  dt.foo[,summary(.SD),.(dataset,geneName),.SDcols="CPM"]
  dt.foo$CPM %>% summary

  #######################################
  # get the p-values (based on logCPMZ) #
  #######################################
  # by outcome
  dt.pval<-dt.foo[,.(Pval=wilcox.test(logCPM~Condition)$p.value),.(dataset,GA,geneName)]
  dt.pval[,Condition:="Case"] # ggsignif complains without this

  # by GA
  dt.pval28.36<-dt.foo[GA %in% c("28wk","36wk") & dataset=="Validation",.(Pval=wilcox.test(logCPM~GA)$p.value),.(dataset,geneName)][,`:=` (`GA1`="28wk",GA2="36wk")]
  dt.pval28.36[,Condition:="Case"] # ggsignif complains without this

  dt.pval20.28<-dt.foo[GA %in% c("20wk","28wk"),.(Pval=wilcox.test(logCPM~GA)$p.value),.(dataset,geneName)][,`:=` (`GA1`="20wk",GA2="28wk")]
  dt.pval20.28[,Condition:="Case"] # ggsignif complains without this

  dt.pval12.20<-dt.foo[GA %in% c("12wk","20wk"),.(Pval=wilcox.test(logCPM~GA)$p.value),.(dataset,geneName)][,`:=` (`GA1`="12wk",GA2="20wk")]
  dt.pval12.20[,Condition:="Case"] # ggsignif complains without this

  dt.foo$Condition<-relevel(dt.foo$Condition, ref="Control")

  #
  #
  p5.lep.pappa2.sig<- ggplot(dt.foo, aes(GA, CPM, col=Condition)) +
    geom_boxplot(outlier.shape=NA,width=.7,size=.5,alpha=.8) +
    geom_point(pch = 21, size=2.5, position = position_jitterdodge(), alpha=.7) +
    scale_y_continuous(trans = scales::log2_trans(),
                       breaks = scales::trans_breaks("log2",n=5, function(x) 2^x),
                       labels = scales::trans_format("log2", scales::math_format(2^.x)),
                        limits=c(min(dt.foo$CPM),max(dt.foo$CPM)*10)) +
    annotation_logticks(base=2,sides="l") +
    ggsci::scale_color_jama() +
    ggsignif::geom_signif(data=dt.pval,
                          aes(xmin = GA, xmax = GA, annotations = format(Pval, scientific=T,digits=2), y_position = 10),
                          textsize = 5, vjust = -0.2, tip_length=0.01,
                          manual = TRUE, color="black") +
    ggsignif::geom_signif(data=dt.pval28.36,
                          aes(xmin = GA1, xmax = GA2, annotations = format(Pval, scientific=T,digits=2), y_position = 8.5),
                          textsize = 5, vjust = -0.2, tip_length=0.03,
                          manual = TRUE, color="black") +
    ggsignif::geom_signif(data=dt.pval20.28,
                          aes(xmin = GA1, xmax = GA2, annotations = format(Pval, scientific=T,digits=2), y_position = 7.5),
                          textsize = 5, vjust = -0.2, tip_length=0.03,
                          manual = TRUE, color="black") +
    ggsignif::geom_signif(data=dt.pval12.20,
                          aes(xmin = GA1, xmax = GA2, annotations = format(Pval, scientific=T,digits=2), y_position = 6.5),
                          textsize = 5, vjust = -0.2, tip_length=0.03,
                          manual = TRUE, color="black") +
    ylab("Count Per Million") + xlab("Gestational Age") +
    facet_grid(geneName~dataset, scales="free_x", space="free_x") +
    theme_Publication() +theme (panel.border = element_rect(colour = "black"),legend.position="top")

  #
  pdf(file="Figures/cfRNA.Fig5.sig.pdf", width=11, height=8.5, title="Fig5: Abundance of LEP and PAPPA2")
  p5.lep.pappa2.sig
  dev.off()
8.5.2 Figure 5B
Code
  my.genes<-c("ALPP", "C2orf72", "CAPN6", "CSHL1", "CYP11A1", "HSD3B1", "LINC00967", "MUC15", "PAPPA", "RAB3B", "SVEP1", "TEAD3", "TFAP2A", "TINCR", "TMEM54","VGLL3") # n=16

  dt.foo<-dl.logCPM[my.genes] %>% rbindlist %>% setnames("geneName","gene")
  dt.bar<-lapply(my.genes, function(my.gene) data.table(gene=my.gene,li.lmer[[my.gene]][["predict"]])) %>% rbindlist

  my.title.y<-latex2exp::TeX(r"($\textbf{log_2 CPM}$)")

  p5.lmer<-
      ggplot(dt.foo, aes(x = GAwk, y = logCPM)) +
      geom_line(aes(group = POPSID), linewidth = .5, col="grey80",alpha=.7) +
      geom_point(aes(color = as.factor(GA)), size=2, alpha=.5) +
      labs(x = "Gestational Age (weeks)", y= my.title.y) +
      theme(legend.position = "top") +
      geom_ribbon(data=dt.bar, aes(ymin=conf.low, ymax=conf.high), alpha=0.6, fill = "grey40") +
      geom_line(data=dt.bar, linewidth=1.5, col="blue",alpha=0.8) +
      scale_x_continuous(breaks=c(12,20,28,36)) +
      scale_color_manual(values=cbPalette2) +
      facet_wrap(~gene, nrow=4, scales="free_y") +
      theme_Publication() +
      theme(legend.position="none")

  #
  pdf(file="Figures/cfRNA.Fig5B.lmer.pdf", width=11, height=11, title="Fig5: longitudinal analysis")
  p5.lmer
  dev.off()